The Structure Was Vibrating Too Hard: The Engine Was
Innocent
A manufacturing plant in Małopolska noticed that the metal support structure holding one of its industrial engines was vibrating harder than the engine's own operation could explain. Standard diagnostics couldn't say for certain whether the problem was in the machine or in the structure holding it.
The risk was clear even when the cause wasn't: progressive mechanical fatigue of the structure, gradual loosening of fastener connections under dynamic load, and — if the source turned out to be the engine itself — premature bearing and coupling wear. The engineering team needed a map, not a guess: where exactly in this structure was the vibration energy concentrating, and what mechanism was driving it.
That question is inherently spatial — and a point sensor measurement is, by definition, unable to answer it. One sensor on one beam tells you that beam is vibrating. It doesn't tell you whether the beam next to it is vibrating more, less, or out of phase — and that spatial relationship is exactly what decides whether you're looking at simple force transmission or something more serious.
'One sensor tells you that beam is vibrating. It doesn't tell you what's happening a metre away.'
The Measurement: The Whole Structure at Once, Under Load
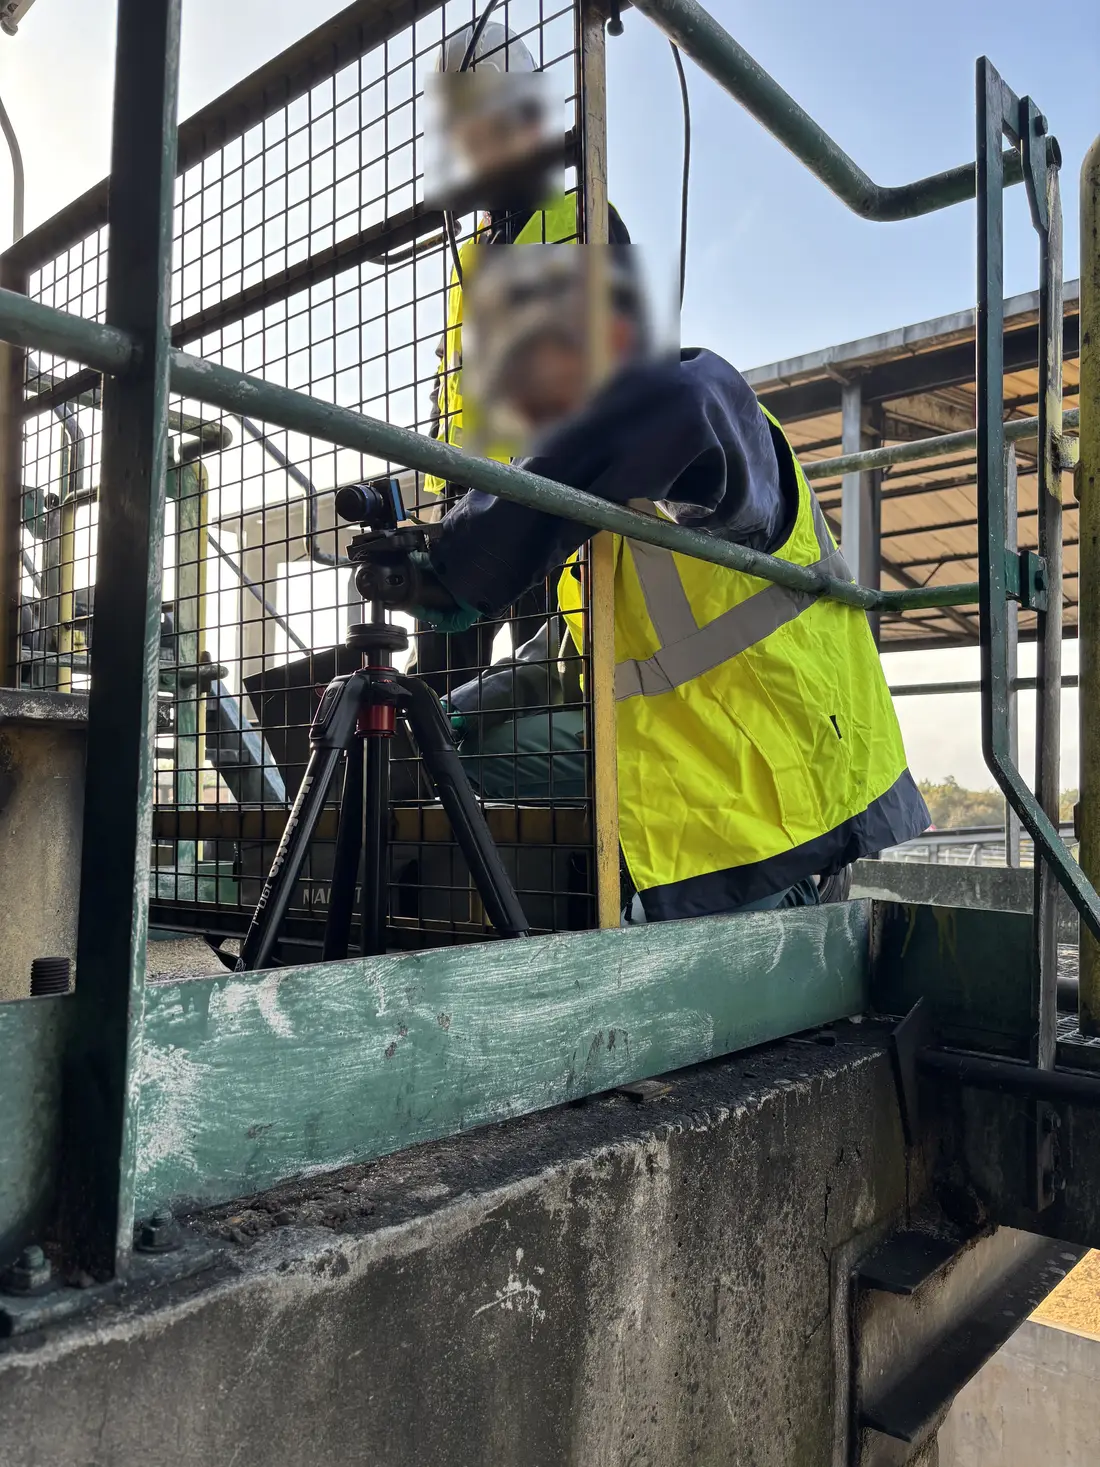
VibraVizja® was used to capture the full-field operational deflection shape (ODS) of the engine's support structure under normal operating conditions — engine running at full load, no modifications, no sensors attached to the structure. The camera recorded the motion of every visible point on the frame simultaneously, turning the entire frame into a dense grid of virtual sensors.
The Discovery: Amplification That Didn't Match the Excitation
The amplified video revealed abnormal vibration amplification at specific, clearly localized points on the support structure — a level of motion completely disproportionate to what the engine alone could have caused. The spatial distribution of that amplified motion was a textbook structural resonance signature: one part of the structure was vibrating far more than the neighbouring sections despite identical excitation.
The mode shape visible in the amplified footage clearly identified exactly which sections of the structure were experiencing the highest dynamic stress — precisely where it was worth concentrating further inspection and reinforcement, instead of checking the entire frame metre by metre.
Structural resonance of the engine support frame, with a natural frequency coinciding with an excitation frequency of the engine under operating load. The engine itself was running correctly — the problem was the dynamic response of the structure holding it. The amplified video gave the engineering team a clear, visual map of the structure's dynamic behaviour as a whole, instead of a single number from one point.
The Result
Instead of disassembling and inspecting the engine — which, as it turned out, was not at fault — the engineering team could direct corrective action straight at a specific section of the support structure. Spatial diagnosis turned a guess into a concrete action plan within a single measurement session.
The same kind of measurement — no sensors installed, no line downtime, results visible on-site — is one we run free of charge for manufacturing plants across Małopolska and the rest of Poland.
Why structural resonance is one of the most commonly missed sources of vibration — and how to find it before it causes a failure.
Why the phase and spatial relationship between points on a structure reveals what a single sensor never will.
See Also
See What VibraVizja® Finds on Your Machines
We travel anywhere in Poland and run a live measurement on one of your assets while it is running at full load — no production stop, no sensors, nothing attached.
Request a Free On-Site Trial